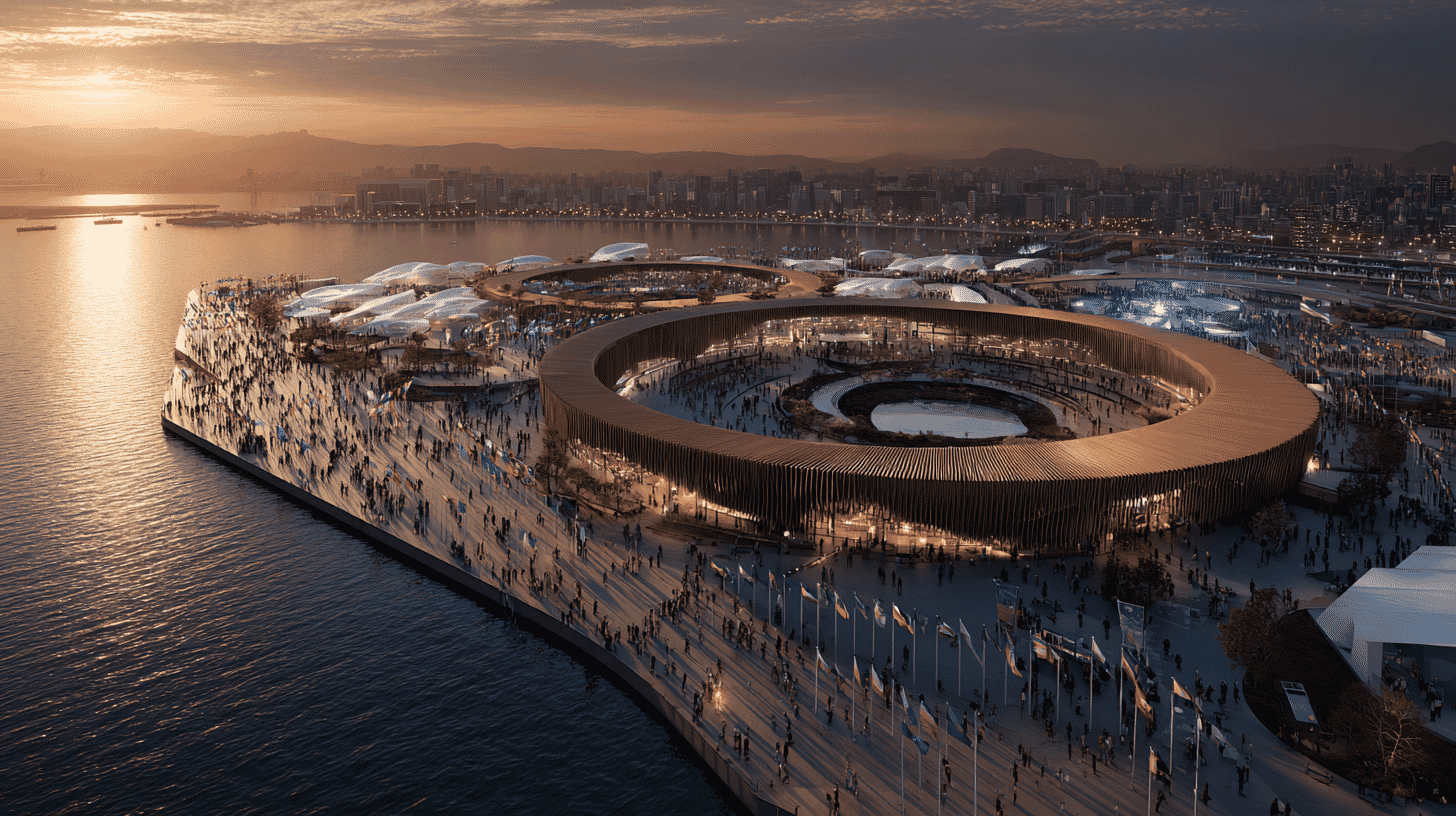
Before it opened, the expo drew criticism for ballooning construction costs and delays. By the time it closed, 29.02 million people had visited and the operating account showed a surplus of 32 to 37 billion yen, far above the 12.9 billion of Aichi Expo in 2005. Most of the construction and infrastructure spending, though, came from taxes. The operating surplus and the value of that public spending are two different questions.
From Criticism to a Surplus
When Osaka-Kansai Expo 2025 opened on April 13 and closed on October 13, it defied expectations. Despite facing significant criticism before opening due to escalating construction costs and preparation delays, the event ultimately achieved visitor numbers and financial results that exceeded projections. This article examines the final financial outcomes and explores whether World Expos can truly be profitable ventures.
Final Results of Osaka Expo 2025
Attendance Figures
According to the Japan Association for the 2025 World Exposition, attendance over the 184-day event period was as follows:
- Total visitors: Approximately 29.02 million
- General visitors: Approximately 25.58 million
- Tickets sold: 22,251,054 (an estimated 1.95 million went unused)
While general visitor numbers fell slightly short of the 28.2 million target, total attendance including officials and staff exceeded expectations. From September onward, a sense that missing it would mean regret took hold, and some weeks averaged over 240,000 visitors a day.
Operating Surplus Exceeds Aichi Expo
In early October 2025, just before closing, the Expo Association projected an operating surplus of 23 to 28 billion yen. It then revised that upward at a board meeting on December 24 to 32 to 37 billion yen, a 9 billion yen improvement after newly reflecting ticket sales from school trips and similar categories. Either way it comfortably exceeds the 12.9 billion yen surplus Aichi Expo posted in 2005.
Key factors behind the surplus:
- Strong ticket sales of 22,251,054, though short of the 23 million target
- Official mascot "Myaku-Myaku" merchandise outselling expectations
- In-venue transaction volume reaching roughly 126 billion yen
Operating costs ballooned to about 116 billion yen, some 1.4 times the original plan, but revenue outran them.
Economic Impact Reaches ¥3.6 Trillion
Ministry of Economy's Final Assessment
On December 25, 2025, Japan's Ministry of Economy, Trade and Industry announced that the expo's economic ripple effect reached 3.6 trillion yen, some 700 billion yen above the 2.9 trillion projected before opening.
Key drivers of this increase included:
- Visitor spending exceeding expectations
- Strong sales of Myaku-Myaku merchandise
- Robust food and retail activity within the venue
Remarkable Inbound Tourism Figures
Analysis by Mastercard and Mitsubishi Research Institute revealed impressive consumption patterns among international visitors:
- International visitors during the expo period: Approximately 21.5 million
- Total spending by international visitors nationwide: ¥4.66 trillion (14% increase year-on-year)
- Spending by approximately 1.56 million expo-visiting tourists: ¥608.5 billion
- Average spending per expo-visiting tourist: ¥390,000 (nearly double the overall average of ¥210,000)
The finding that expo visitors spent nearly twice as much as typical international tourists demonstrates the event's ability to attract high-value travelers.
Regional Economic Effects
International visitor spending in Osaka City increased 28% year-on-year to ¥503.7 billion. The Bay Area (Konohana, Minato, Taisho, and Suminoe wards) saw a 42% increase, while spending along the Osaka Metro Chuo Line grew 65% to ¥63.7 billion, showing clear economic ripple effects along access routes to the venue.
Cost Structure and Financial Balance
Overview of Expo-Related Costs
Major expenses associated with the expo included:
- Venue construction: Approximately ¥235 billion (increased from initial ¥125 billion)
- Operating costs: Approximately ¥116 billion
- Related infrastructure: Approximately ¥83.9 billion
- Other costs (direct government support, developing country assistance, etc.): Over ¥160 billion
Construction costs were split equally among the national government, Osaka Prefecture and City, and the business community. The business community's share came up about 4.2 billion yen short, to be covered by a donation from the Kansai Osaka 21st Century Association, a foundation run on proceeds from the 1970 Osaka Expo. Operating costs ran on a self-supporting basis centered on ticket revenue, and ended in surplus.
Break-Even Analysis
The pre-opening plan assumed ticket revenue would cover about 80 percent of the 116 billion yen in operating costs, with merchandise covering the remaining 20 percent. Against a break-even point of 18.4 million tickets, actual sales of 22.25 million left a comfortable margin.
Comparison with Aichi Expo: What Made the Difference?
Side-by-Side Comparison
| Category | Aichi Expo (2005) | Osaka Expo (2025) |
|---|---|---|
| Visitors | ~22.05 million | ~29.02 million (total) |
| Operating Surplus | ~¥12.9 billion | ¥32-37 billion |
| Theme | Nature's Wisdom | Designing Future Society for Our Lives |
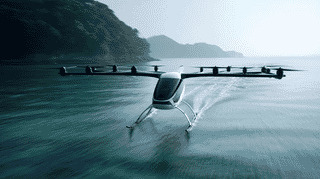
| Main Attractions | Frozen Mammoth | Grand Ring, Flying Cars, etc. |
Success Factors Analysis
Aichi Expo exceeded its initial projection of 15 million visitors to attract 22.05 million, achieving approximately ¥13 billion surplus. Success factors included a clear theme of "harmony with nature," beloved mascot characters Morizo and Kiccoro, and strong repeat visitation from local residents.
Osaka Expo similarly benefited from mascot Myaku-Myaku's popularity, late-surge FOMO-driven repeat visits, and successful capture of inbound tourism demand.
What Makes an Expo Profitable?
Short-Term Revenue Maximization
- Compelling Content: Unique exhibitions like frozen mammoths or flying cars
- Character Strategy: Merchandise revenue contribution
- Repeat Visitation: Seasonal events and incentives for multiple visits
- Premium Services: VIP tours and special experiences to increase per-visitor spending
Cost Control Importance
Just as Aichi Expo achieved profitability partly by reducing construction costs by approximately ¥35 billion, cost management remains crucial. However, Osaka Expo's ability to cover 1.4x cost overruns through increased revenue is noteworthy.
Long-Term Perspective
Whether an expo "pays off" cannot be measured by operating surplus alone. Factors to consider include:
- Economic Ripple Effects: Tourism and consumption spillover to the broader region
- Inbound Impact: Demonstrated ability to attract high-value travelers
- Post-Event Land Use: a memorial park and whatever follows it
- City Branding: Enhanced international recognition
However, construction and infrastructure costs burden national and local governments, requiring comprehensive post-event evaluation.
So, Was It Profitable?
On the operating account alone, yes. But total costs, including construction escalating from roughly 125 billion yen to 235 billion yen plus related infrastructure, run to several hundred billion yen, most of it public money. The operating surplus and the cost-effectiveness of that public spending are separate questions and deserve to be argued separately.
The final balance, including venue demolition and the settling of debts and receivables, will not be fixed until after the association dissolves in March 2028. Today's figures are an interim read.
Update: Clearing the site is under way. Demolition of the Grand Ring began in December 2025, and by April 13, 2026, a year after the opening, 30 percent of it was down. About 200 metres of the north-east section, out of a 2,025-metre circumference, will be kept close to its original form, with Osaka City laying out roughly 3.3 hectares around it as a memorial park. An EXPO 2025 memorial hall is under consideration, with the prefecture and city expected to split the cost. Some of the removed timber is going to areas hit by the 2024 Noto earthquake for reuse in disaster public housing. The whole site is due to be cleared and returned to Osaka City by February 2028.
One clarification: the integrated resort with its casino is not going on the expo site itself but on Yumeshima Phase 1, immediately to the north. Construction started in April 2025, with opening targeted for autumn 2030. The expo site, Phase 2, is at the stage of awaiting a master plan due around spring 2026, after which developers will be invited to bid (as of September 2026).
How does your country discuss the economic impact of mega-events like World Expos or the Olympics? What are the public opinions on government spending for such large-scale international events? Share your thoughts in the comments!
References
- https://www.expo2025.or.jp/news/news-20251014-01/
- https://www.nikkei.com/article/DGXZQOUA253X60V21C25A2000000/
- https://www.nikkei.com/article/DGXZQOUF146TY0U5A011C2000000/
- https://www.nikkei.com/article/DGXZQOUF300UI0Q5A930C2000000/
- https://news.yahoo.co.jp/articles/6c08f8ae780fea4834eff98d2edea7ae84ee1f7b
- https://www.meti.go.jp/policy/exhibition/keizaihakyukouka.pdf
- https://www.apir.or.jp/research/post15592/







Global Discussion
15 comments