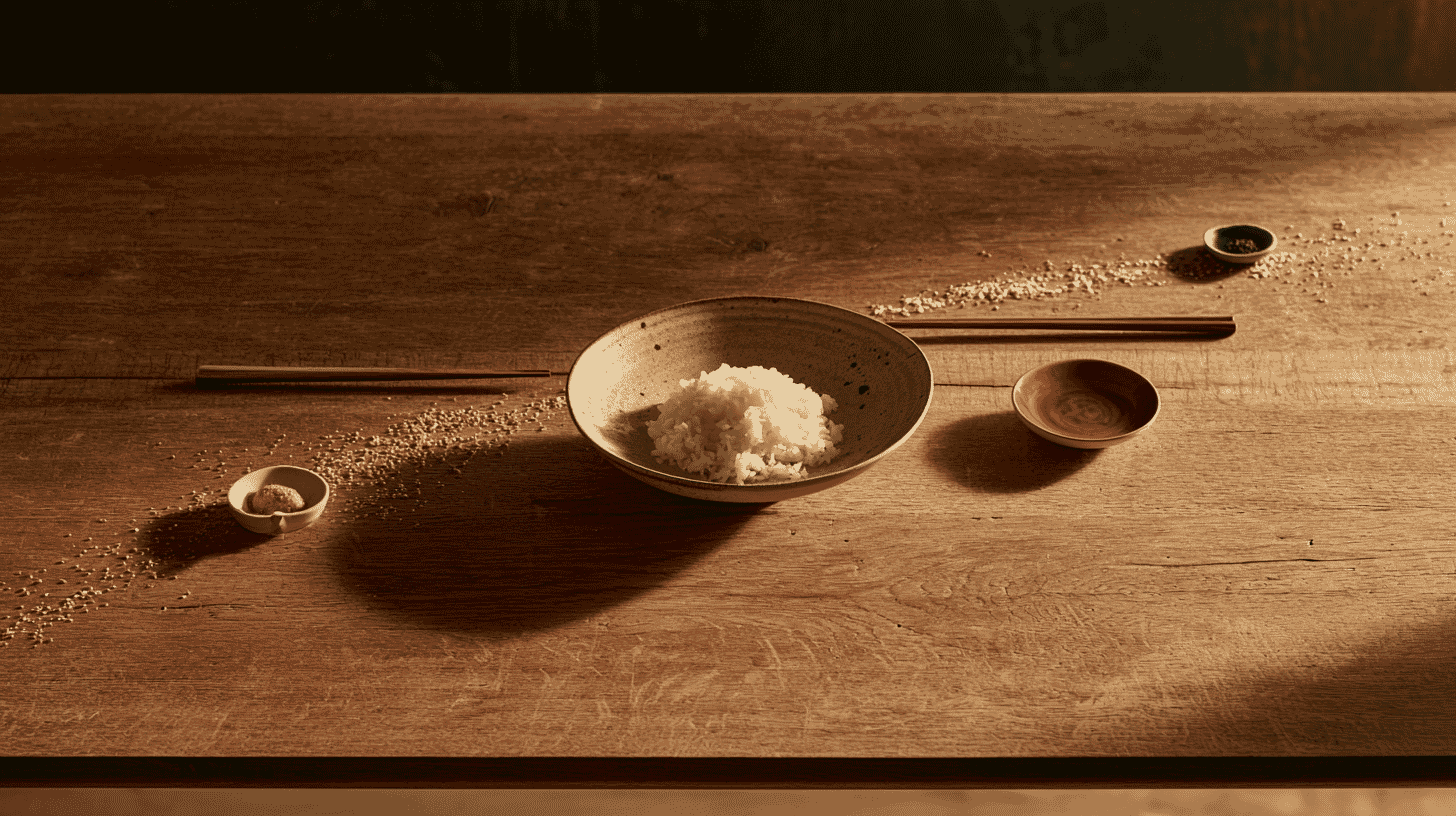
🌾 Japanese farms grew more rice last year than the year before. Japan also just recorded its lowest food self-sufficiency rate in the six decades it has kept the statistic. Both sentences are true, and the reason they are both true has less to do with Japanese farms than with Japanese wallets.
On August 7, the Ministry of Agriculture, Forestry and Fisheries published the figure for fiscal 2025, the year running from April 2025 to March 2026. On a calorie basis, Japan produced 37% of the food it consumed, down a point from the year before. The same press release carried a second number pointing the opposite way: measured by production value, self-sufficiency climbed two points to 66%.
Two numbers, opposite directions
Japan reports its food self-sufficiency three different ways, and in fiscal 2025 they did not agree with each other.
The calorie-based rate divides domestic calories by total calories supplied: 830 kilocalories out of 2,237 per person per day, or 37%. The production-value rate divides the value of what Japanese farms and fisheries produced, ¥14.5 trillion (about $92 billion), by the value of what the country consumed, ¥21.8 trillion (about $138 billion). That comes to 66%. A third measure, added under the 2025 basic plan on food and agriculture, fixes the denominator at 1,850 kilocalories, what a person needs in ordinary times, instead of counting everything put on the shelf. It came to 45%.
Thirty-seven percent is not unprecedented. Japan hit it in fiscal 1993, when a cold summer wrecked the rice harvest, and again in 2018 and 2020. The ministry says that once you go past the decimal point, fiscal 2025 is the lowest reading in a series that begins in 1965. That first year, the figure was 73%.
A price shock, not a harvest failure
Nothing failed in the rice fields. What happened was that rice got expensive.
Japan's rice market has been unsettled since the summer of 2024, when shelves emptied, prices surged and the government began releasing reserve stocks. By the ministry's own accounting, domestic rice prices rose 48% over fiscal 2025.
Per-person rice consumption slipped from 53.3 kilograms a year to 52.0, a drop of about 2%. That one line took 0.8 points off the national calorie rate, most of the entire one-point fall. Over the twelve months to June 2026, demand for domestically grown table rice came to 6.83 million tons, the lowest on record, as buyers moved to cheaper imported grain. Rice from outside the state trading quota carries a tariff of ¥341 per kilogram, and even with that loaded on, American Calrose and Taiwanese japonica were undercutting the domestic price on Japanese shelves.
Farms, meanwhile, planted more. The 2025 crop delivered 7.18 million tons of table rice, up 662,000 tons, from 1.367 million hectares, an increase of 108,000 hectares. More rice was grown and more of it sat in private warehouses. What shrank was the number of buyers.
The same 48% price rise that dragged the calorie rate down pushed the value rate up. Rice alone contributed 1.9 points to the production-value figure and livestock another 0.9, helped by a 26% jump in egg prices. Vegetables and seafood pulled in the other direction as output fell roughly 4% in each category.
One crop holds up the whole figure
Rice matters this much because of how thin everything else is.
Of the 2,237 calories supplied to the average person each day, rice grown in Japan accounts for about 21% of the total. Set that against a domestic share of 37% and the arithmetic is stark: more than half of everything Japan feeds itself is rice. On a calorie basis, rice is 96% domestic. Almost nothing else comes close. Wheat is 16%, soybeans 25%, fruit 28%, fats and oils 4%.
Livestock, at 17%, deserves an asterisk. Japan raises plenty of animals, but the calorie method subtracts the imported feed they eat, and Japan's feed self-sufficiency is 24%. Remove that rule and the picture inverts: the "domestic production rate" for livestock is 66% rather than 17%, and for eggs it is 97% rather than 11%. Both numbers describe the same farms. They answer different questions, one about food supply in a crisis, the other about the size of the domestic industry.
So the national headline turns on a single habit, one that has been thinning for sixty years. In fiscal 2025 the price tag sped that up.
Where the other 63% comes from
The ministry estimates that four sources cover 84% of the calories on Japanese tables: domestic production at 37%, the United States at 26%, Canada at 11% and Australia at 10%.
The American share is mostly not what people eat directly. Corn accounts for 13% of Japan's entire calorie supply, and most of it becomes animal feed. Wheat adds 5%, soybeans 4%. Three countries supply close to half the calories in a nation of 120 million people.
How that compares with the US, Europe and China
On a calorie basis, using the ministry's own international estimates for 2023, Australia comes in at 257% and Canada at 195%, both thinly populated countries growing enormous quantities of grain and oilseed. France reaches 119% and the United States 112%. Germany is 81%, the United Kingdom 56%, Italy 51%, Switzerland 46%. Japan, at 37%, sits at the bottom of that list.
Flip to production value and the ranking scrambles. Australia leads at 141%, Canada 115%, France 74%, Italy 72%. Japan comes next at 66%, ahead of the United States at 64%, the UK at 62%, Switzerland at 58% and Germany at 42%. Japan's farms are not economically marginal. They are concentrated in expensive, low-calorie products: vegetables, fruit, fish, premium beef.
China sits outside the table, because it does not publish a calorie-based rate at all. Its policy language is different in kind, set at a Communist Party rural work conference in 2013: basic self-sufficiency in grain overall, and absolute security in the staples people eat directly. Rice and wheat carry an official target of 100% and sit close to it. Soybeans are the exposed flank. China is by far the world's largest importer. The US Department of Agriculture puts its 2025/26 intake at about 112 million tons, against domestic output that has run near 20 million. Brazil and the United States supply most of it. Two very different agricultural systems, converging on the same weak point, which is feed and oilseed rather than the food on the plate.
These comparisons are estimates, and it matters who made them. The ministry calculates almost all of them itself from its own food balance sheets and FAO data. In the entire table, only two figures come from the other governments' own publications: Switzerland's calorie rate and Britain's production-value rate. Most countries simply do not lead their national conversation with a calorie-based number.
The target keeps receding
The basic plan adopted in April 2025 set three goals for 2030: 45% on calories, 69% on production value, 53% on intake calories. Fiscal 2025 landed at 37%, 66% and 45%.
Only one of those is within reach, and it got there by an odd route. The production-value rate closed to within three points of its target because food got more expensive at home, not because more of it was grown.
That effect is already unwinding. Private rice stocks stood at 2.43 million tons at the end of June 2026, the largest ever recorded and well above the 1.8 to 2 million considered normal. In the week to August 2, the average supermarket price of rice was ¥3,198 (about $20) for five kilograms, a sixth consecutive weekly decline and the first reading below ¥3,200 in roughly a year and ten months. Prices are easing, which is welcome at the checkout and will push the production-value rate back down next year.
The 45% target will not be met from the field side alone. What ends up on the table carries just as much weight.
What does your country count when it measures how much of its own food it grows, and would the answer look different if it counted something else?
References
- https://www.maff.go.jp/j/press/kanbo/anpo/260807.html
- https://www.maff.go.jp/j/press/kanbo/anpo/attach/pdf/260807-2.pdf
- https://www.maff.go.jp/j/zyukyu/zikyu_ritu/011.html
- https://www.nikkei.com/article/DGXZQOUA061BZ0W6A800C2000000/
- https://www.jiji.com/jc/article?k=2026080700655&g=eco
- https://www.jiji.com/jc/article?k=2026080700897
- https://www.jiji.com/jc/article?k=2026072800283&g=eco
- https://www.maff.go.jp/j/council/seisaku/kikaku/bukai/attach/pdf/250327-7.pdf
- https://www.maff.go.jp/j/council/seisaku/syokuryo/251224/attach/pdf/1224-9.pdf
- https://www.maff.go.jp/primaff/seika/pickup/2021/21_02.html
- https://www.maff.go.jp/j/council/seisaku/syokuryo/250131/attach/pdf/250131-146.pdf
- https://www.alic.go.jp/chosa-c/joho01_004192.html
- https://www.tokyo-np.co.jp/article/503424




Global Discussion
4 comments